class: center, middle, inverse, title-slide # trendEcon ## Daily economic indicators based on Google searches ### <br>Angelica Becerra (ETH KOF)<br>Vera Z. Eichenauer (ETH KOF)<br>Ronald Indergand (SECO)<br>Stefan Legge (University of St.Gallen)<br>Isabel Martinez (ETH KOF, formerly SGB)<br>Nina Mühlebach (ETH KOF)<br>Furkan Oguz (ETH KOF)<br>Christoph Sax (cynkra)<br>Kristina Schuepbach (SGB and University of Bern)<br>Severin Thöni (ETH KOF)<br>Uwe Thümmel (University of Zurich) ### <br>pre-conference eRum2020::CovidR / 2020-05-29 --- exclude: true <style type="text/css"> code.r{ font-size: 16px; } pre { font-size: 16px !important; } </style> --- class: bg-main1 # Why trendEcon? <br><br> -- ### During the Covid-19 pandemic, information about the economic and social situation has changed rapidly. 📉 <br><br> -- ### Traditional economic indicators have a significant .yellow[lag] of up to 3 months, and are .yellow[not sufficiently frequent] to monitor the economy and social activity at high frequency during times of rapid change 🕣 <br><br> -- ### The project was initiated during the [#versusvirus](https://www.versusvirus.ch/) hackathon from April 3 to April 5. <br><br> --- class: bg-main1 # Our solution -- ### We use Google search trends to overcome this data gap and create meaningful indicators. -- ### We extract daily search data on keywords reflecting consumers' perception. <img src="slide_img/gtrend_ex.gif" width=80%> --- layout: true class: split-two with-border border-white .column[ .split-three[ .row.bg-main1[.content.font2[ Indicators based on Google Trends. ]] .row.bg-main2[.content.font2[ R package [trendecon](https://trendecon.github.io/trendecon/) ]] .row.bg-main3[.content.font2[ Website [www.trendecon.org](https://www.trendecon.org/) using flexdashboard. ]] ]] .column.bg-main1[.content.center.vmiddle[ {{content}} ]] --- class: hide-row2-col1 hide-row3-col1 <img src="slide_img/trendecon.gif" width=100%> --- class: hide-row3-col1 <img src="slide_img/package.png" width=100%> --- class: <img src="slide_img/web.png" width=100%> --- class: fade-row2-col1 fade-row3-col1 <img src="slide_img/trendecon.gif" width=100%> --- layout: false class: bg-main1 # General steps .blockquote.font_large[ Use Google Trends data for keywords such as “Wirtschaftskrise” and “Insolvenz”. </br></br> ] --- class: bg-main1 # General steps .blockquote.font_large[ Use Google Trends data for keywords such as “Wirtschaftskrise” and “Insolvenz”. </br></br> Retrieve Google Trends data through the Google API.</br></br> ] --- class: bg-main1 # General steps .blockquote.font_large[ Use Google Trends data for keywords such as “Wirtschaftskrise” and “Insolvenz”. </br></br> Retrieve Google Trends data through the Google API.</br></br> Construct indicators using PCA.</br></br> ] --- class: bg-main1 # General steps .blockquote.font_large[ Use Google Trends data for keywords such as “Wirtschaftskrise” and “Insolvenz”. </br></br> Retrieve Google Trends data through the Google API.</br></br> Construct indicators using PCA.</br></br> Compare the data to existing economic indicators.</br></br> ] --- class: middle bg-main1 # It looks very simple....but <img src="slide_img/no.gif" width=50%> --- class: bg-main1 #Sampling issues ##If you query Google Trends for a search term, e.g., insolvenz, the result is based on a subsample of all search results. </br> -- 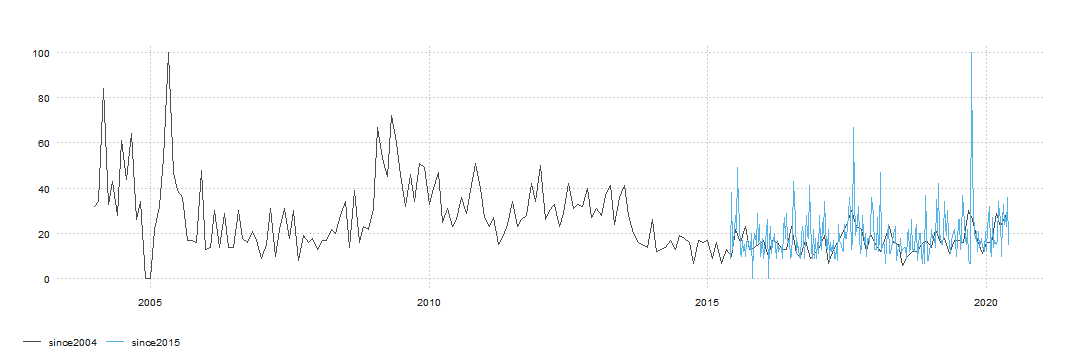<!-- --> -- --- class: bg-main1 #Available data </br> ##Google search results are available on a daily, weekly or monthly frequency; depending on the time window queried. </br> ##Our goal is to produce long daily time series, ideally from 2006, but Google does not provide daily or weekly data for such a long time period. --- class: middle bg-main1 # How did we solve this? </br> # You can check [www.trendecon.org/#method](https://www.trendecon.org/#method) </br> # We create the R package [trendecon](https://trendecon.github.io/trendecon/) </br> --- class: split-two with-border border-white fade-row1-col1 fade-row3-col1 .column[ .split-three[ .row.bg-main1[.content.font2[ Indicators based on Google Trends. ]] .row.bg-main2[.content.font2[ R package [trendecon](https://trendecon.github.io/trendecon/) ]] .row.bg-main3[.content.font2[ Website .yellow[www.trendecon.org] using flexdashboard. ]] ]] .column.bg-main1[.content.center.vmiddle[ <img src="slide_img/package.png" width=100%> ]] --- class: bg-main1 #[trendecon](https://trendecon.github.io/trendecon/) package </br> </br> .font_large[ + Construct long daily time series from Google Trends ] --- class: bg-main1 #[trendecon](https://trendecon.github.io/trendecon/) package </br> </br> .font_large[ + Construct long daily time series from Google Trends. </br> </br> + Robustness of the data is achieved by querying Google mulitple times. ] --- class: bg-main1 #[trendecon](https://trendecon.github.io/trendecon/) package </br> </br> .font_large[ + Construct long daily time series from Google Trends. </br> </br> + Robustness of the data is achieved by querying Google mulitple times. </br> </br> + The queries are sampled at daily, weekly and monthly frequencies and then harmonized such that the long term trend is preserved. ] --- class: bg-main1 #[trendecon](https://trendecon.github.io/trendecon/) package </br> </br> .font_large[ + Construct long daily time series from Google Trends. </br> </br> + Robustness of the data is achieved by querying Google mulitple times. </br> </br> + The queries are sampled at daily, weekly and monthy frequencies and then harmonized such that the long term trend is preserved. </br> </br> + The download itself relies on the [gtrendsR](https://cran.r-project.org/web/packages/gtrendsR/index.html) package by Philippe Massicotte and Dirk Eddelbuettel. ] --- class: bg-main1 # Installation ## You can install the trendecon package from GitHub. ```r # install.packages("remotes") remotes::install_github("trendecon/trendecon") ``` --- class: bg-main1 # Usage ## To download a series from Google Trends: ```r x <- ts_gtrends("cinema", geo = "CH") ``` ``` ## Downloading data for today+5-y ``` ```r #> Downloading data for today+5-y tsbox::ts_plot(x) ``` 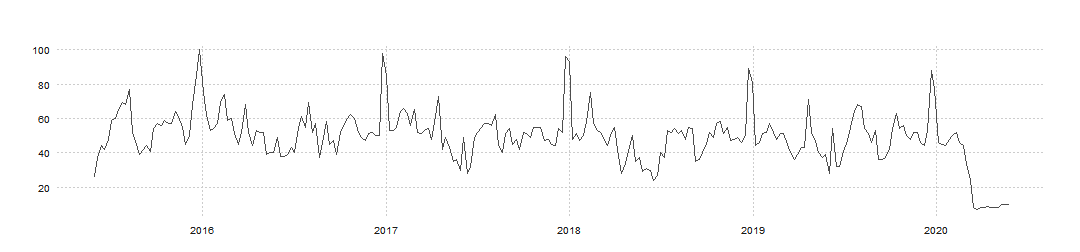<!-- --> --- class: split-25 bg-main1 fade-row2-col2 with-border .row[ #Usage Same parameters as ``gtrendsR::gtrends()``.<br>But with ``trendecon::ts_gtrends()`` you will have independent downloads for each keyword.] .row[ .split-two.with-border[ .column.bg-main2[.content[ .center[``gtrendsR::gtrends()``] ```r gtrends_dwload <- gtrends(keyword = c("theater","kino"), geo = "CH", time = "today 12-m") gtrends_dwload$interest_over_time %>% ggplot(...) ``` 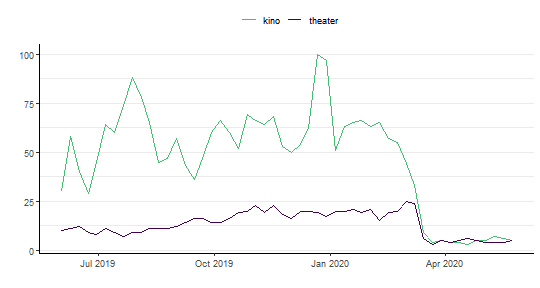<!-- --> ]] .column.bg-main3[.content[ .center[``trendecon::ts_gtrends()``] ```r trendecon_dwload <- ts_gtrends(keyword = c("theater","kino"), geo = "CH", time = "today 12-m") tsbox::ts_ggplot(trendecon_dwload) + ... ``` <!-- --> ]] ]] --- class: split-25 bg-main1 fade-row2-col1 with-border .row[ #Usage Same parameters as ``gtrendsR::gtrends()``.<br>But with ``trendecon::ts_gtrends()`` you will have independent downloads for each keyword.] .row[ .split-two.with-border[ .column.bg-main2[.content[ .center[``gtrendsR::gtrends()``] ```r gtrends_dwload <- gtrends(keyword = c("theater","kino"), geo = "CH", time = "today 12-m") gtrends_dwload$interest_over_time %>% ggplot(...) ``` <!-- --> ]] .column.bg-main3[.content[ .center[``trendecon::ts_gtrends()``] ```r trendecon_dwload <- ts_gtrends(keyword = c("theater","kino"), geo = "CH", time = "today 12-m") tsbox::ts_ggplot(trendecon_dwload) + ... ``` 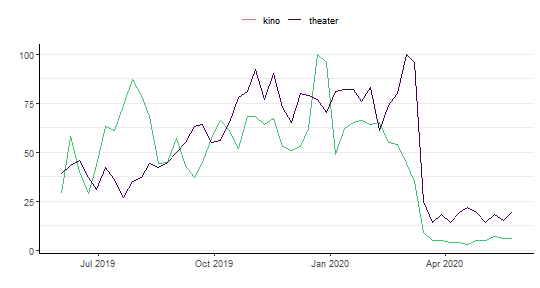<!-- --> ]] ]] --- class: split-25 bg-main1 fade-row2-col2 with-border .row[ #Usage Independent download is important because you might end up with many zeros.] .row[ .split-two.with-border[ .column.bg-main2[.content[ .center[``gtrendsR::gtrends()``] ```r gtrends_dwload <- gtrends(keyword = c("insolvenz","kino"), geo = "CH", time = "today 12-m") gtrends_dwload$interest_over_time %>% ggplot(...) ``` 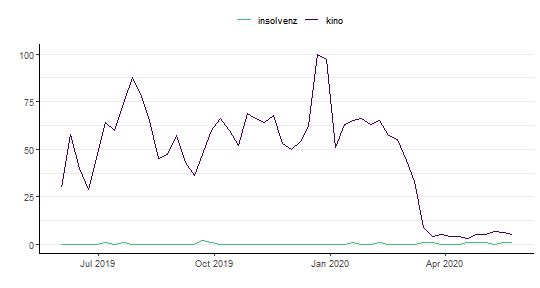<!-- --> ]] .column.bg-main3[.content[ .center[``trendecon::ts_gtrends()``] ```r trendecon_dwload <- ts_gtrends(keyword = c("insolvenz","kino"), geo = "CH", time = "today 12-m") tsbox::ts_ggplot(trendecon_dwload) + ... ``` <!-- --> ]] ]] --- class: split-25 bg-main1 fade-row2-col1 with-border .row[ #Usage Independent download is important because you might end up with many zeros.] .row[ .split-two.with-border[ .column.bg-main2[.content[ .center[``gtrendsR::gtrends()``] ```r gtrends_dwload <- gtrends(keyword = c("insolvenz","kino"), geo = "CH", time = "today 12-m") gtrends_dwload$interest_over_time %>% ggplot(...) ``` <!-- --> ]] .column.bg-main3[.content[ .center[``trendecon::ts_gtrends()``] ```r trendecon_dwload <- ts_gtrends(keyword = c("insolvenz","kino"), geo = "CH", time = "today 12-m") tsbox::ts_ggplot(trendecon_dwload) + ... ``` 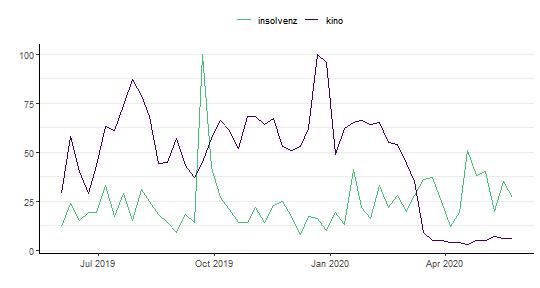<!-- --> ]] ]] --- class: split-two with-border border-white fade-row1-col1 fade-row2-col1 .column[ .split-three[ .row.bg-main1[.content.font2[ Indicators based on Google Trends. ]] .row.bg-main2[.content.font2[ R package [trendecon](https://trendecon.github.io/trendecon/) ]] .row.bg-main3[.content.font2[ Website [www.trendecon.org](https://www.trendecon.org/) using flexdashboard. ]] ]] .column.bg-main1[.content.center.vmiddle[ Indicators. <br><br>Data available online. <br><br>R package.<br><br> <img src="slide_img/web.png" width=100%> ]] --- class: middle bg-main1 <img src="slide_img/thank_you.gif" width=50%> # [www.trendecon.org](https://www.trendecon.org/)